Microsoft has released a preview version of Windows Admin Center to Windows Insiders. The version has been upgraded from 1902 to 1903. Here is a list of improvements given by Microsoft which includes monitoring tools for Active Directory users, groups, etc.
Extension notifications
To help make extension discovery and update easier, we’ve added the following features:
- Notification will appear when you connect to a server/cluster and there is an extension available that supports the hardware manufacturer and model. Information for implementing this in the extension package will be provided to our extension developer partners and you will start seeing these notifications as partners update their extensions in the future. In the next release, we plan to provide an option to turn off these notifications if the user chooses.
- Notification will appear if you open a tool/extension and an update for the extension is available to install. (Known issue: In desktop mode, the notification will tell you to contact your gateway admin to install the update, and this will be fixed in an upcoming release.)
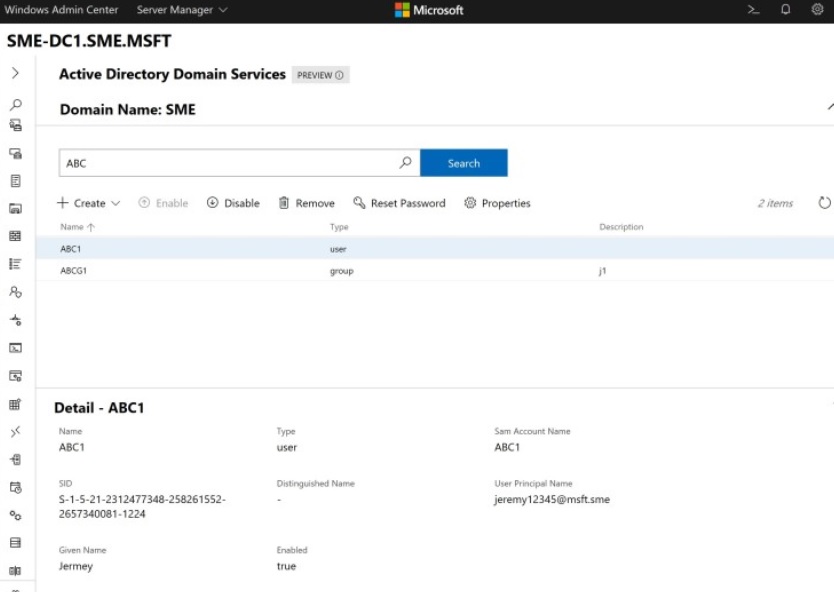
New tool – Active Directory

After installing the Active Directory extension from the extension feed, the tool will appear when you connect to a server that is a domain controller. In this version of the tool, you can:
- View domain details such as DNS root, forest, and domain mode
- Create users, configure basic user properties, and group memberships
- Create groups and manage membership
- Search for users, computers, and groups (search limited to 10 of each type in this release)
- View details pane for users, computers, and groups
- Enable/disable, and remove user or computer objects
- Reset user passwords
- Configure resource-based constrained delegation on a computer object (use this to configure single sign-on for your Windows Admin Center gateway deployment!)
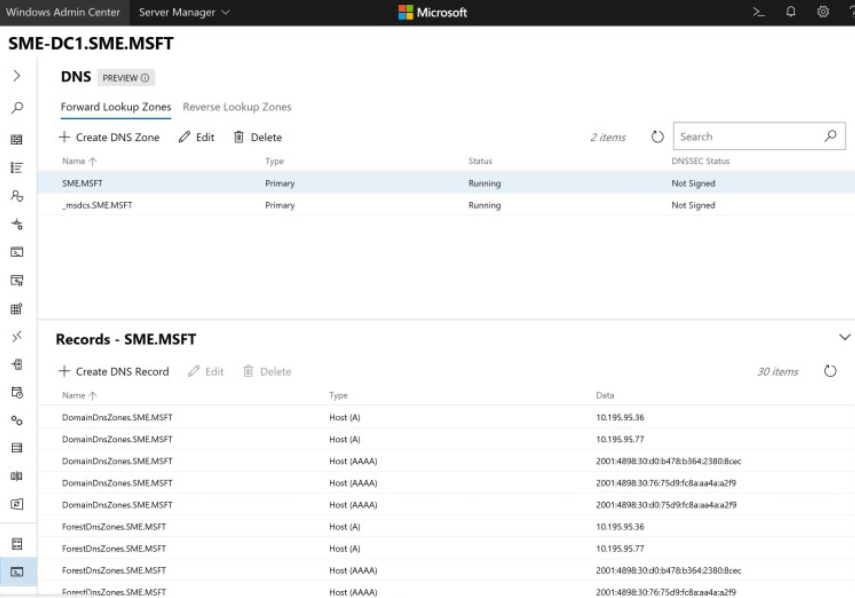
New tool – DNS

After installing from the extension feed, the DNS tool will appear when your server is configured as a DNS server. In this version of the DNS tool, you can:
- View details of DNS Forward Lookup zones, Reverse Lookup zones and DNS records
- Create Forward Lookup zones in different types (primary, secondary and stub), configure Forward lookup zone properties like master servers, dynamic update, zone file location, etc.
- Create Host (A or AAAA), CNAME or MX type of DNS records, configure DNS records properties such as FQDN, TTL, etc.
- Create IPV4 and IPV6 Reverse Lookup zones in different types (primary, secondary and stub), configure reverse lookup zone properties like Network ID, zone file name and location, Master Servers, etc.
- Create PTR, CNAME type of DNS records under reverse lookup zone, configure DNS records properties such as HOST IP Address, FQDN, TTL, etc.
New tool – DHCP
After installing from the extension feed, the DHCP tool will appear when your server is configured as a DHCP server. In this version of the tool, you can:
- View IPV4 and IPV6 scope details such as IP distribution status, usage of IP addresses, address exclusions and address reservations.
- Create IPV4 and IPV6 scopes, configure scopes properties such as IP address range, Router, lease duration of DHCP client and Activate/Deactivate IPV4/IPV6 scopes
- Create address exclusions and configure start and end IP address
- Create address reservations and configure client MAC address (IPV4), DUID and IAID (IPV6)
Azure Monitor
Our #1 UserVoice request was to enable email notifications from Windows Admin Center. Now, with the added integration with Azure Monitor, you can configure custom email notifications about your server health, using the robust alerting framework of Azure Monitor. With Azure Monitor’s free 5 GB of data per month/customer allowance, you can easily try this out for a server or two without worry of getting charged. Read on to see additional benefits of onboarding servers into Azure Monitor, such as getting a consolidated view of systems performance across the servers in your environment.
Set up your server for use with Azure Monitor, coming this week!
Note: We are releasing this feature with Windows Admin Center Preview 1903 to Windows Insiders today, however there is a pending API update in Azure that is not rolled out yet. The feature will not be functional end-to-end until the update in Azure is live by the end of the week, March 29th.
From the Overview page of a server connection, click the new button “Manage alerts”, or go to Server Settings > Monitoring and alerts. Within this page, onboard your server to Azure Monitor by clicking “Set up” and completing the setup pane. Admin Center takes care of provisioning the Azure Log Analytics workspace, installing the necessary agent, and ensuring the VM insights solution is configured. Once complete, your server will send performance counter data to Azure Monitor, enabling you to view and create email alerts based on this server, from the Azure portal.
Create email alerts
Once you’ve attached your server to Azure Monitor, you can use the intelligent hyperlinks within the Settings > Monitoring and alerts page to navigate to the Azure Portal. Admin Center automatically enables performance counters to be collected, so you can easily create a new alertby customizing one of many pre-defined queries, or writing your own.
Get a consolidated view across multiple servers
If you onboard multiple servers to a single Log Analytics workspace within Azure Monitor, you can get a consolidated view of all these servers from the Virtual Machines Insights solution within Azure Monitor (tackling another top 10 UserVoice request!) Note that only the Performance and Maps tabs of Virtual Machines Insights for Azure Monitor will work with on-premises servers – the health tab functions only with Azure VMs. To view this in the Azure portal, go to Azure Monitor > Virtual Machines (under Insights), and navigate to the “Performance” or “Maps” tabs.
Visualize apps, systems, and services connected to a given server
When Admin Center onboards a server into the VM insights solution within Azure Monitor, it also lights up a capability called Service Map. This capability automatically discovers application components and maps the communication between services so that you can easily visualize connections between servers with great detail from the Azure portal. You can find this by going to the Azure portal > Azure Monitor > Virtual Machines (under Insights), and navigating to the “Maps” tab.
Note: The visualizations for Virtual Machines Insights for Azure Monitor is currently supported for the following Azure regions only: East US, West Central US, West Europe, and Southeast Asia. You must deploy the Log Analytics workspace in one of these regions to get the additional benefits provided by the Virtual Machines Insights solution described above.
With all the additions in this release also come a handful of known issues you should be prepared for. These include an error setting up Azure Monitor which is expected to be fixed by the end of the week, as well as an error when trying to load Windows Admin Center using Google Chrome. Here’s the full list:
Azure Monitor – If you try to set up Azure Monitor and get an error, then Azure has not finished rolling out a required API update. Please try again later; the update in Azure is scheduled to complete by the end of the week, March 29th.
Virtual Machine Settings – If you attempt to change a VM setting within a Hyper-Converged or Failover Cluster connection, you will receive an error notification and the setting change will fail. The workaround solution is to connect to the Hyper-V host that the VM resides on as a Server connection and make the VM setting change there. This bug will be fixed in the next release.
Network – If you have configured an Azure Network Adapter, the value under Microsoft Azure Virtual Network Gateway Address will be formatted as a hyperlink but leads to an invalid address. [20420185]
Extension update notification – In desktop mode, the notification will tell you to contact your gateway admin to install the update. This bug will be fixed in the next release. [20646984]
Azure Update Management onboarding – If you get an error setting up or using Azure Update Management, this is a known issue which will also be fixed by the Azure API change described in the Azure Monitor section above. If you have already installed the MMA agent, or install the agent using the new integration for Azure Monitor, you will not be able to onboard the server to Azure Update Management through the UI in Windows Admin Center. If Azure Update Management is already configured (whether through Admin Center or another way), you can still onboard the server to the Azure Monitor Virtual Machines Insights solution using the Windows Admin Center UI.
Chrome users may see 403 Forbidden response from WAC after upgrading. The workaround is to close *all* open chrome tabs (make sure there are no chrome.exeprocesses running). After restarting chrome, everything will function normally. We have an error message that makes this clear, but chrome users with multiple windows admin center tabs open during upgrade will not see the message.

