

Microsoft Excel is an extremely popular Office application among students, offices, researchers. It facilitates a plethora of options to create a huge table. You can create graphs, pie charts, trends of a particular business or scientific model and so on. The numbers of features are almost endless.
In MS Excel, we work on big tables, charts and huge chunks of data. Once, you create a table and perform all mathematical or other relevant operations, you may want to edit the table appearance by inserting proper borders, inserting different colors on different rows and columns, so as to lift the table clarity. The process of doing that is very easy. In the following tutorial, you will learn to insert rows and columns in MS Excel Worksheets.
This feature is applicable for Excel for Office 365, Excel 2019, Excel 2016, Excel 2013, Excel 2010.
Steps To Insert Colors In Rows And Column Heads In MS Excel Worksheets
First, select the row or column, or text where you want to fill color.
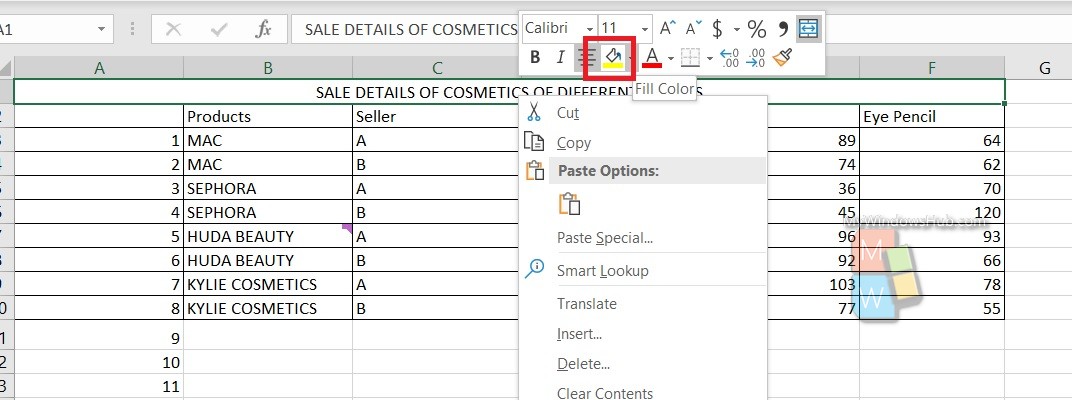
Next, you have to right click and select the Fill Color option.
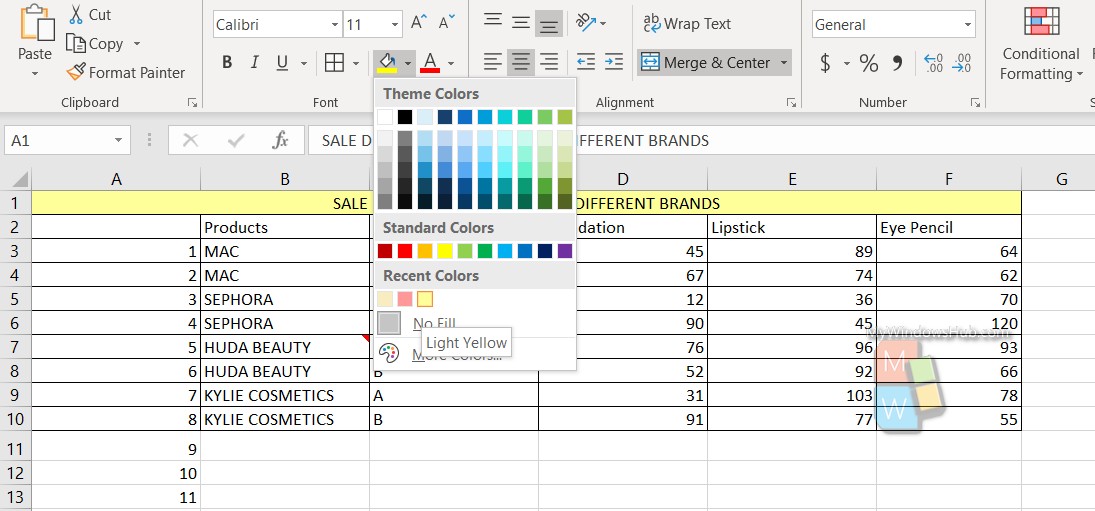
Choose the color. You can select colors from the pallette by choosing specific RGB combinations.
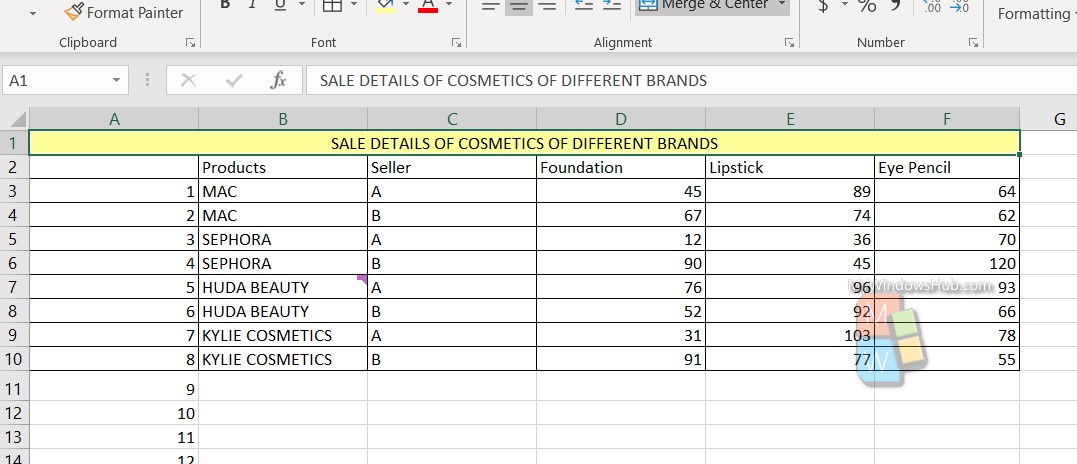
That’s all!