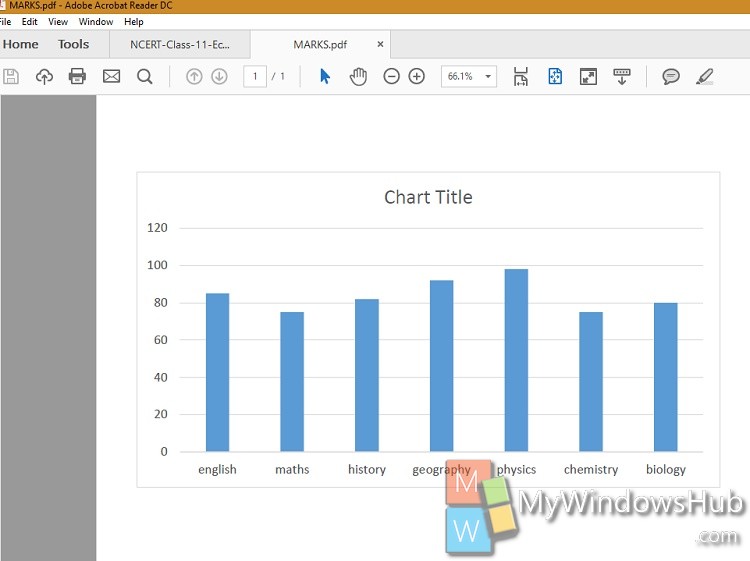
The following article will show you how to export graphs in Microsoft Excel directly to PDF Files.
Steps to Save MS Excel 2016 graphs To A PDF File?
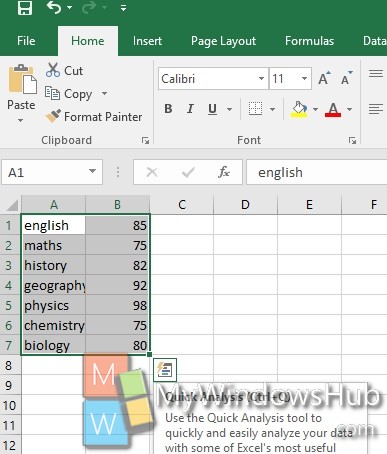
1. First select the data set that you want to plot.
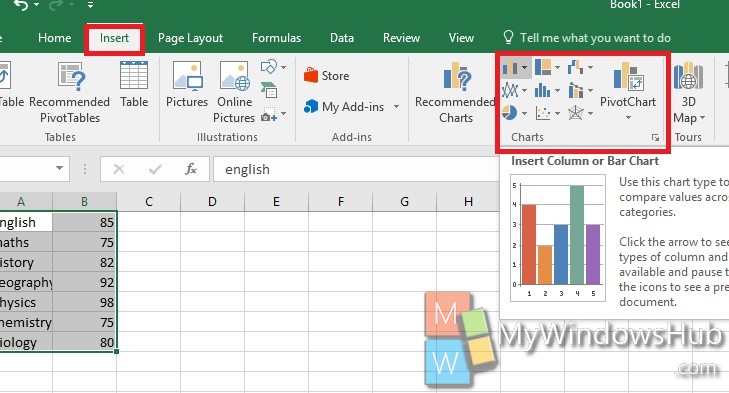
2. Go to Insert and select a graph of your choice.
3. Now as the graph is created, just tap on the graph to select it. Now go to File.
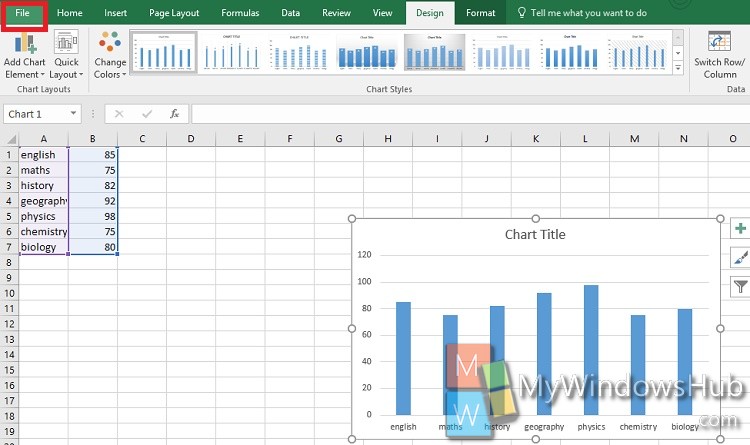
4. Select Save As, name the file and select the file type PDF File.
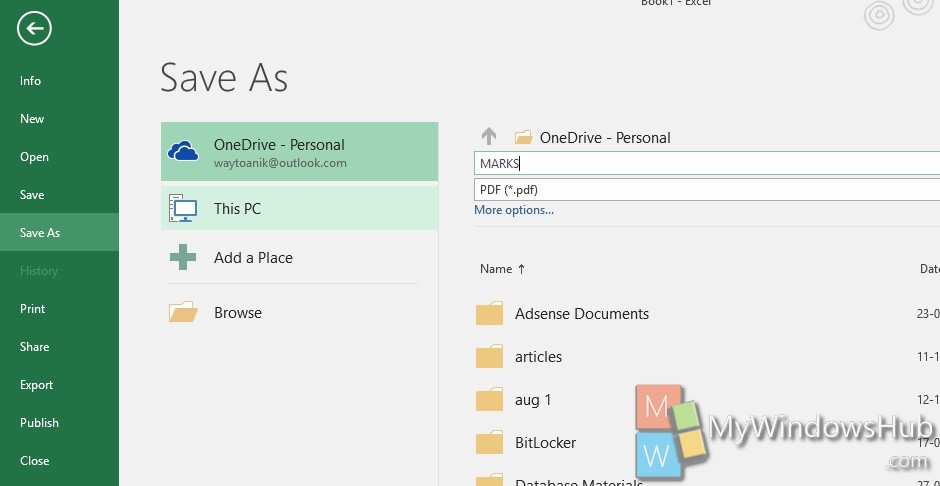
5. The pdf file of the graph is created.
